
AWS Certified AI Practitioner(11) - Agents
📊 Amazon Bedrock & CloudWatch
📌 What is CloudWatch?
Amazon CloudWatch is a monitoring service for AWS resources and applications.
It provides:
- Logs – Detailed records of events and invocations
- Metrics – Numerical measurements of system performance
- Alarms – Notifications when thresholds are crossed
- Dashboards – Visualizations for monitoring
🔑 Bedrock & CloudWatch Integration
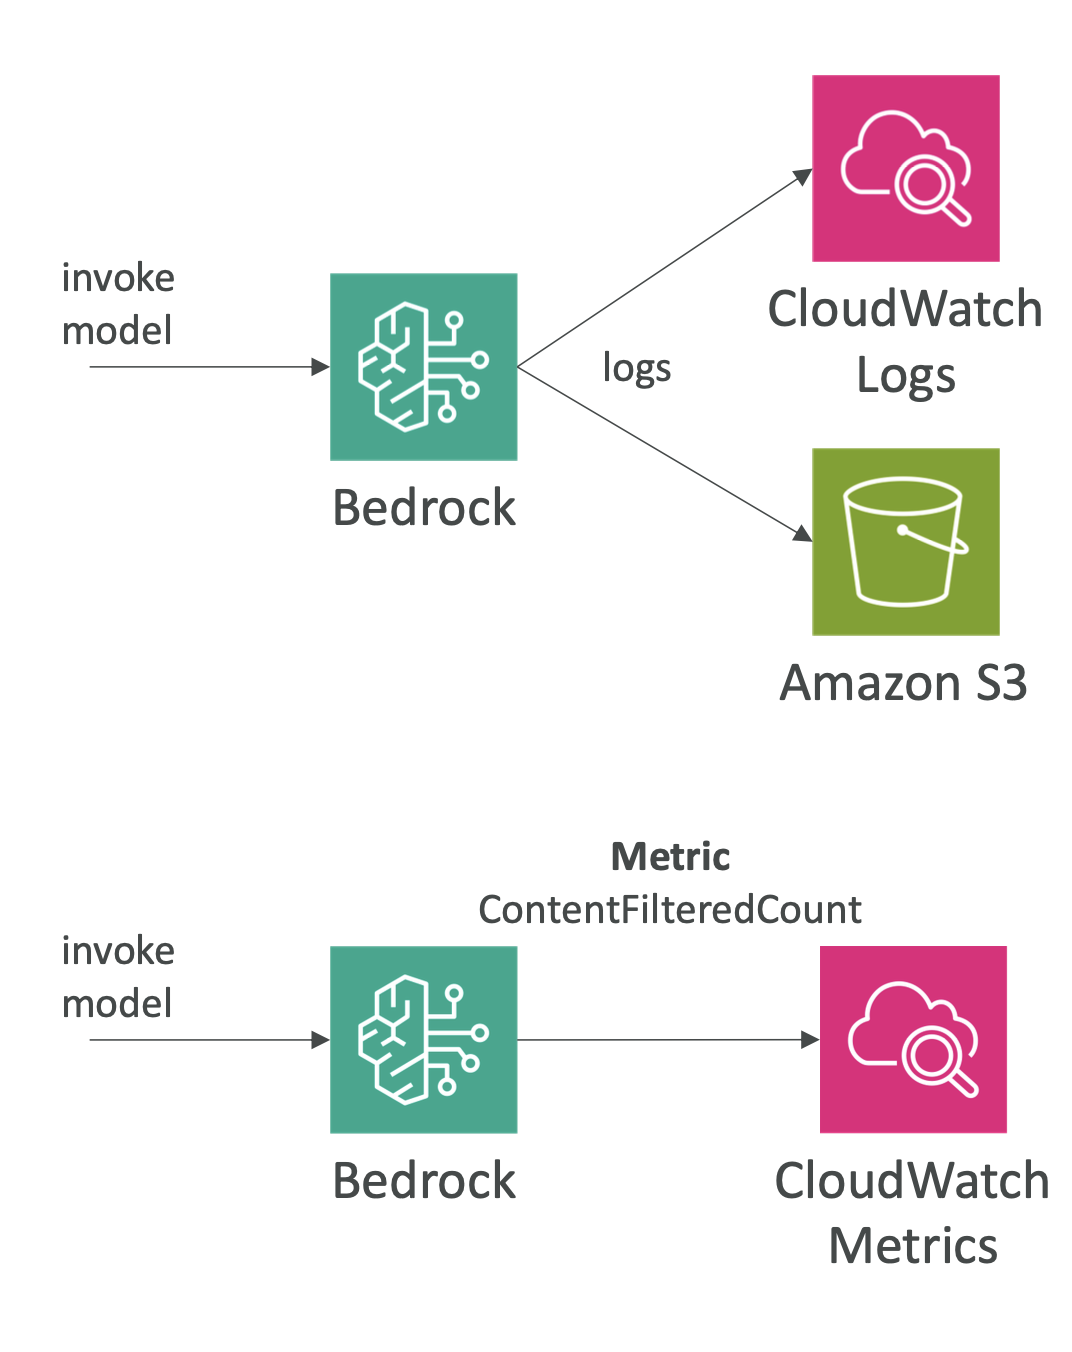
1. Model Invocation Logging
- Logs all inputs and outputs from Bedrock model invocations.
- Data can include:
- Text
- Images
- Embeddings
- Logs can be sent to:
- Amazon CloudWatch Logs (real-time monitoring)
- Amazon S3 (long-term storage)
- Benefits:
- Full history of model usage
- Debugging issues (e.g., latency, token count, configuration errors)
- Real-time log analysis with CloudWatch Logs Insights
2. CloudWatch Metrics
- Bedrock publishes key metrics into CloudWatch.
- Examples:
- Invocation count
- Invocation latency (how long the model takes to respond)
- Token usage
- ContentFilteredCount → shows how often Guardrails blocked unsafe content
- Benefits:
- Track model performance over time
- Identify bottlenecks (e.g., latency spikes)
- Ensure guardrails are working correctly
- Build CloudWatch Alarms to get alerts (e.g., if latency exceeds 5 seconds)
⚙️ Example Workflow
Enable Invocation Logging in Bedrock console.
- Choose destination: CloudWatch or S3.
- Configure log group (e.g.,
BedrockInvocationLogs). - Assign IAM role for Bedrock → CloudWatch integration.
Run Model Invocation
- Example: Bedrock model processes a text input.
- Logs show:
- Model ID (e.g.,
Amazon.Titan-Text-Express-V1) - Region
- Input & output tokens
- Latency (e.g., 4,038 ms)
- Model ID (e.g.,
Monitor in CloudWatch
- Logs: Inspect invocation details for debugging.
- Metrics: View invocation trends, latency graphs.
- Alarms: Trigger alerts when thresholds are exceeded.
📝 Summary Table
| Feature | Explanation | Example Use |
|---|---|---|
| Invocation Logging | Capture all model inputs/outputs | Save logs to CloudWatch or S3 |
| Supported Data | Text, images, embeddings | Debug user queries |
| Logs Insights | Real-time log queries & analysis | Track latency spikes |
| Metrics | Performance stats from Bedrock | Invocation count, latency, tokens |
| ContentFilteredCount | Guardrail monitoring | See how often harmful content is blocked |
| Alarms | Notify when thresholds exceed | Alert if latency > 5s |
✅ Why This Matters
- Transparency → See exactly how Bedrock is used.
- Reliability → Detect performance issues early.
- Compliance & Safety → Track Guardrail effectiveness.
- Optimization → Use metrics to fine-tune workloads.
👉 In summary:
Integrating Amazon Bedrock with CloudWatch provides full visibility into model usage, performance, and safety.
You can log invocations, analyze data, track metrics, and set alarms — ensuring your AI applications are secure, efficient, and reliable.
All articles on this blog are licensed under CC BY-NC-SA 4.0 unless otherwise stated.