
AWS Certified AI Practitioner(27) - Model Evaluation - Classification & Regression
📊 Model Evaluation – Classification & Regression
When building ML models, it’s not enough to just train them—you also
need to evaluate how good they are. Different problems (classification
vs regression) use different metrics. Let’s break it down.
🔹 Binary Classification Example – Confusion Matrix
A confusion matrix compares actual labels (truth) with the model’s
predictions.
- True Positive (TP): predicted positive, actually positive\
- False Positive (FP): predicted positive, actually negative\
- True Negative (TN): predicted negative, actually negative\
- False Negative (FN): predicted negative, actually positive
👉 Goal: maximize TP and TN, minimize FP and FN.
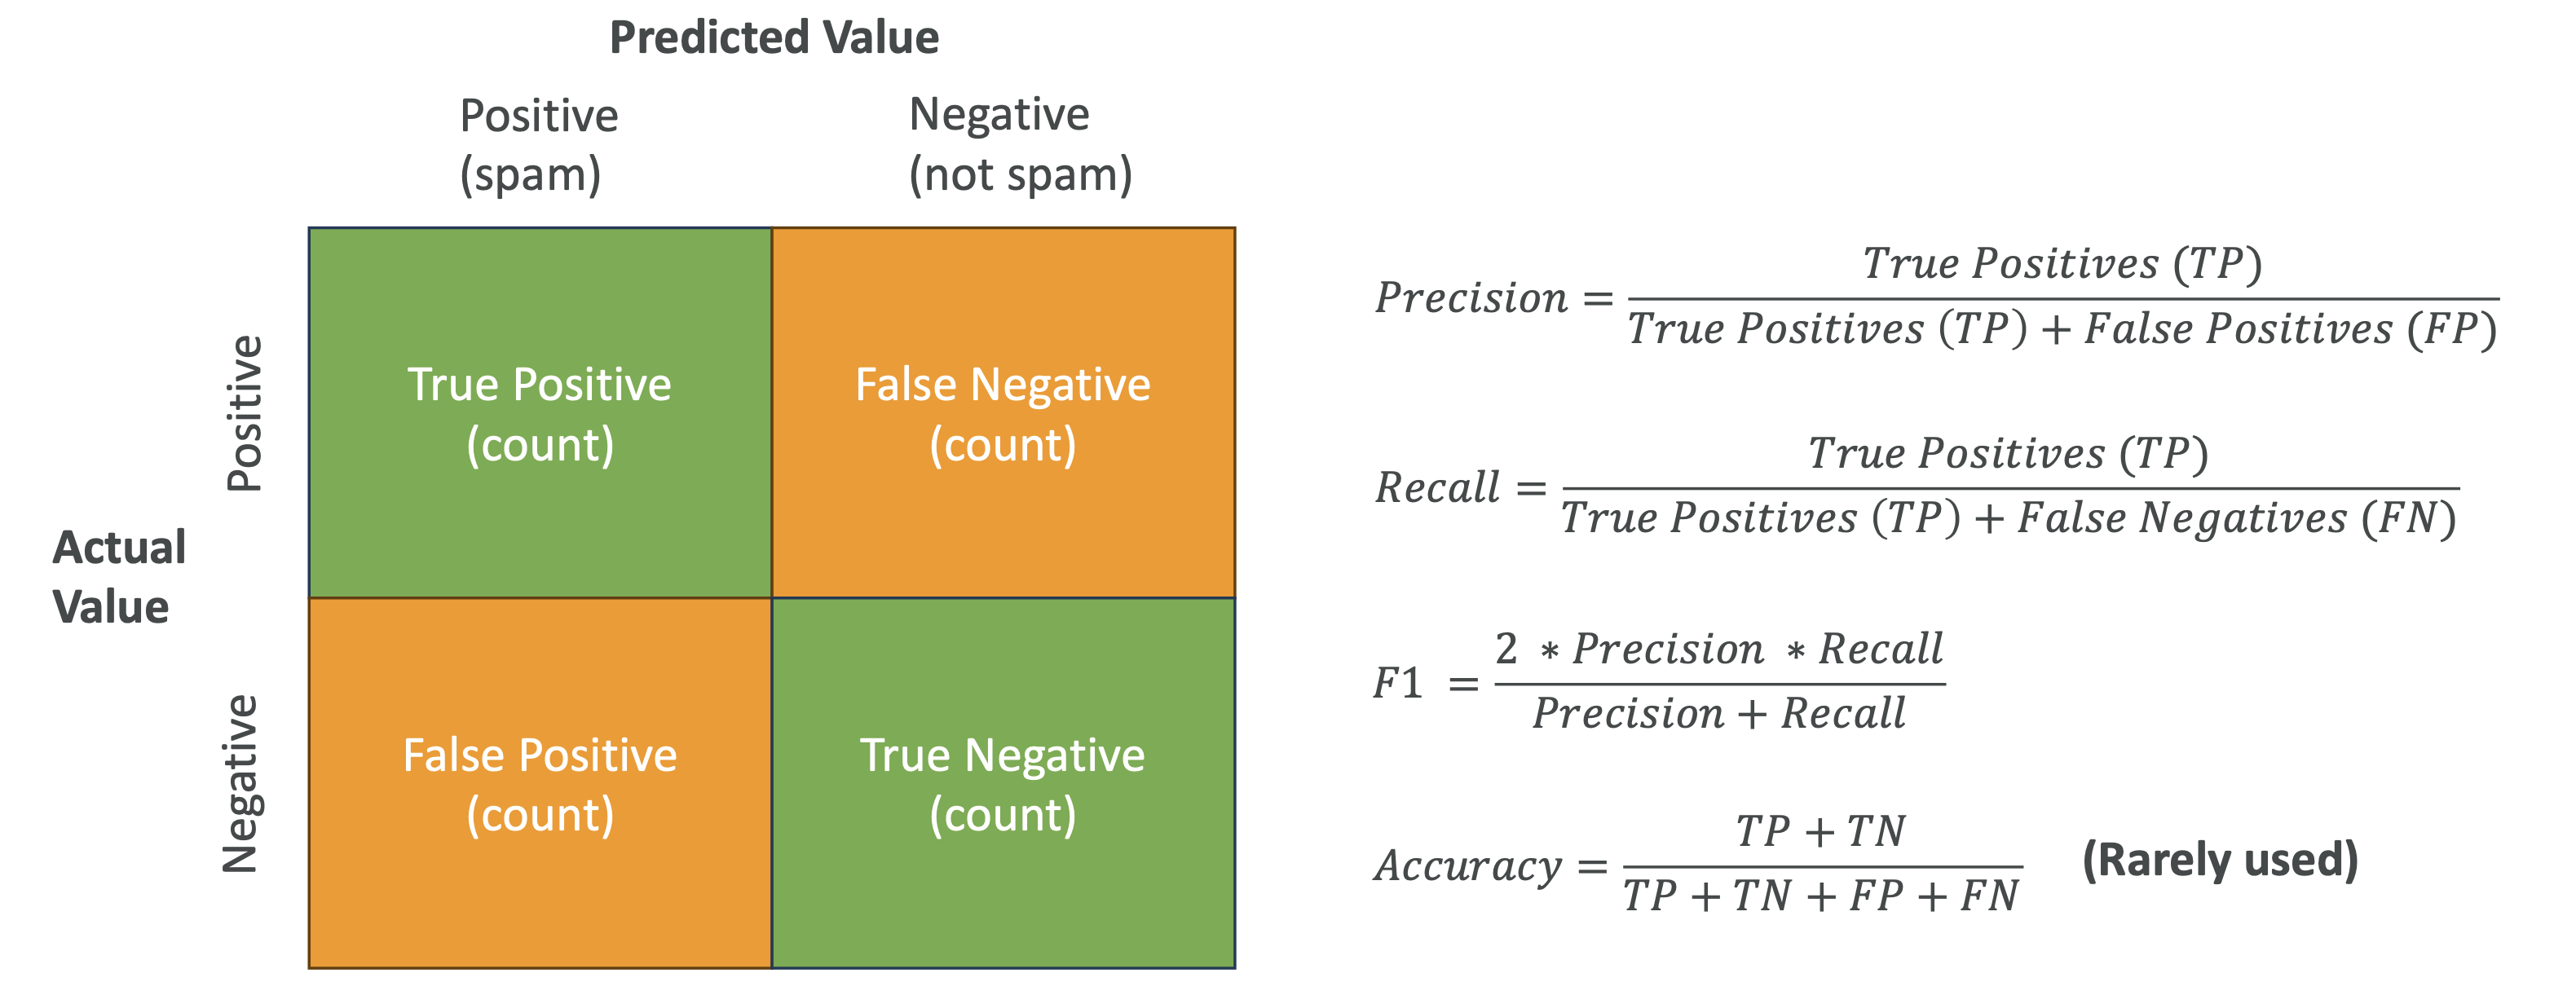
Key Metrics
Precision = TP / (TP + FP)
“Of all predicted positives, how many were actually positive?”
Best when false positives are costly (e.g., diagnosing a healthy
person as sick).Recall = TP / (TP + FN)
“Of all actual positives, how many did we correctly identify?”
Best when false negatives are costly (e.g., missing a cancer
diagnosis).F1 Score = 2 × (Precision × Recall) / (Precision + Recall)
Harmonic mean of precision and recall.
Best for imbalanced datasets where accuracy alone is misleading.Accuracy = (TP + TN) / (All predictions)
Useful only for balanced datasets.
Example: If 95% of emails are “not spam,” a model that always
predicts “not spam” has 95% accuracy but is useless.
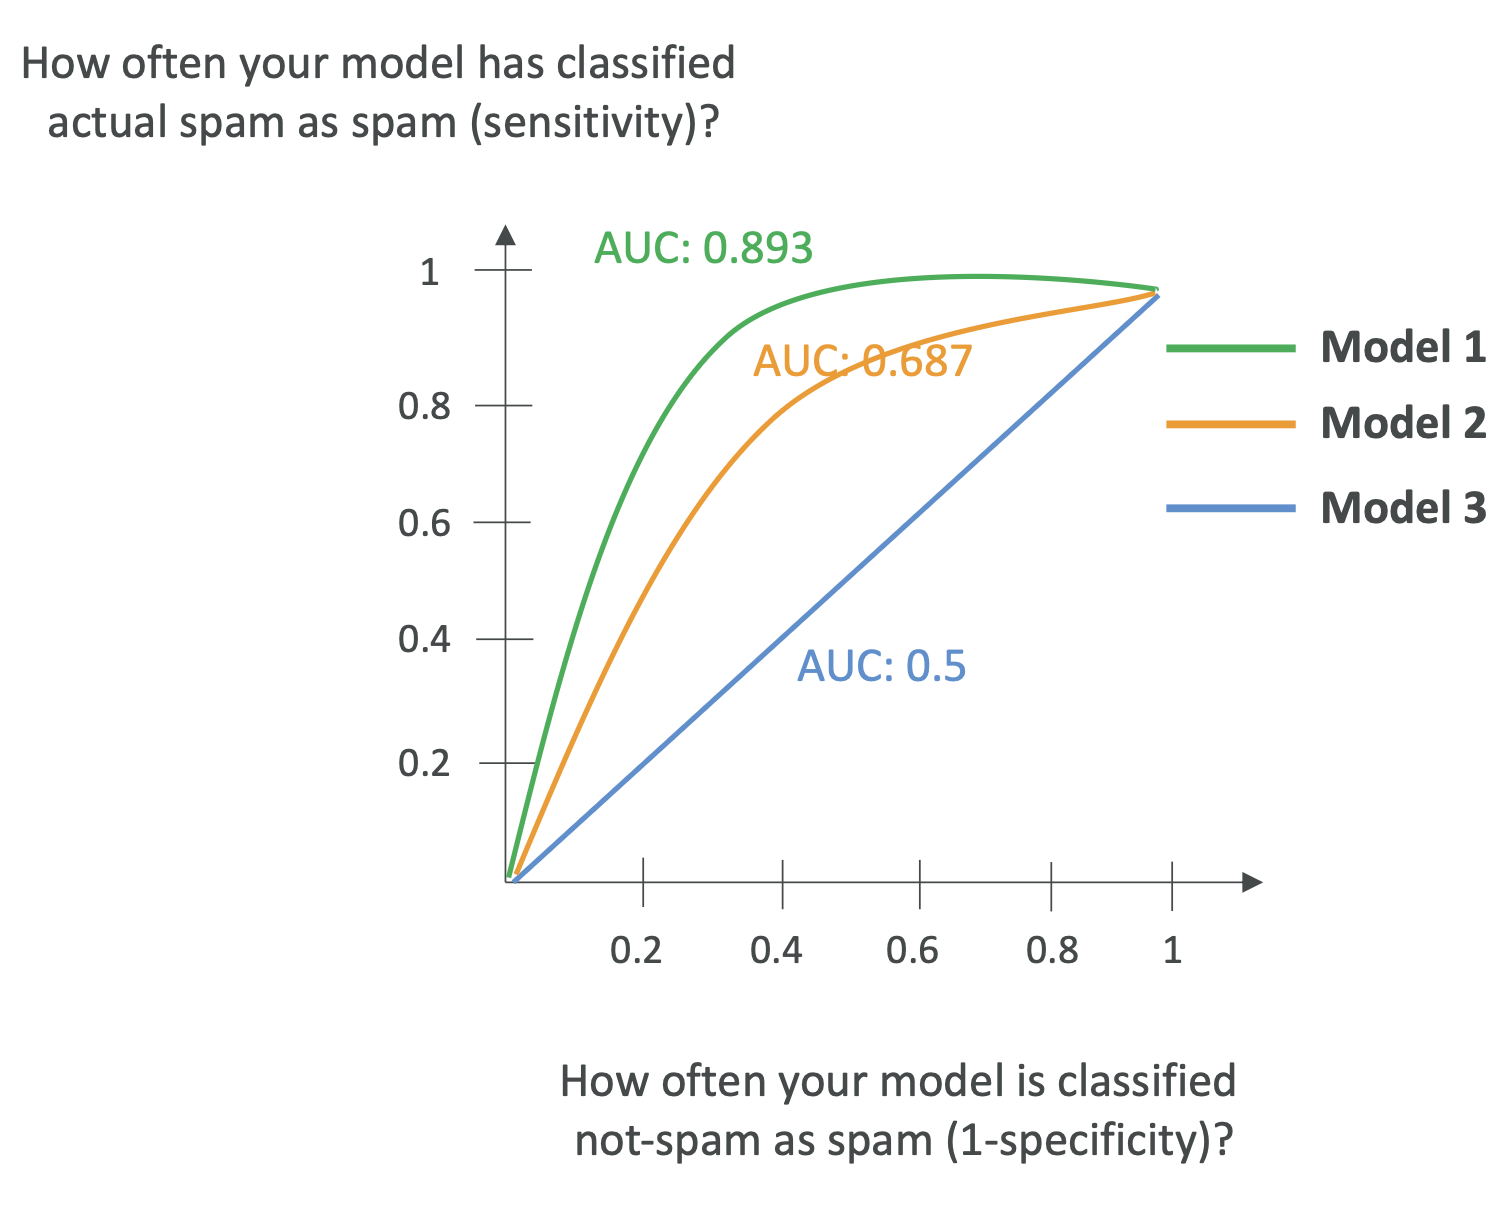
🔹 AUC-ROC (Area Under the Curve – Receiver Operator Curve)
- Plots True Positive Rate (Sensitivity/Recall) vs False
Positive Rate (1 - Specificity) at various thresholds.\ - AUC value ranges from 0 to 1.
- 1.0 = perfect model\
- 0.5 = random guessing
👉 Business use case: choose a threshold that balances precision and
recall for your needs (fraud detection, medical tests, etc.).
📌 Exam Tip: Remember AUC-ROC helps compare multiple models and find
the best threshold.
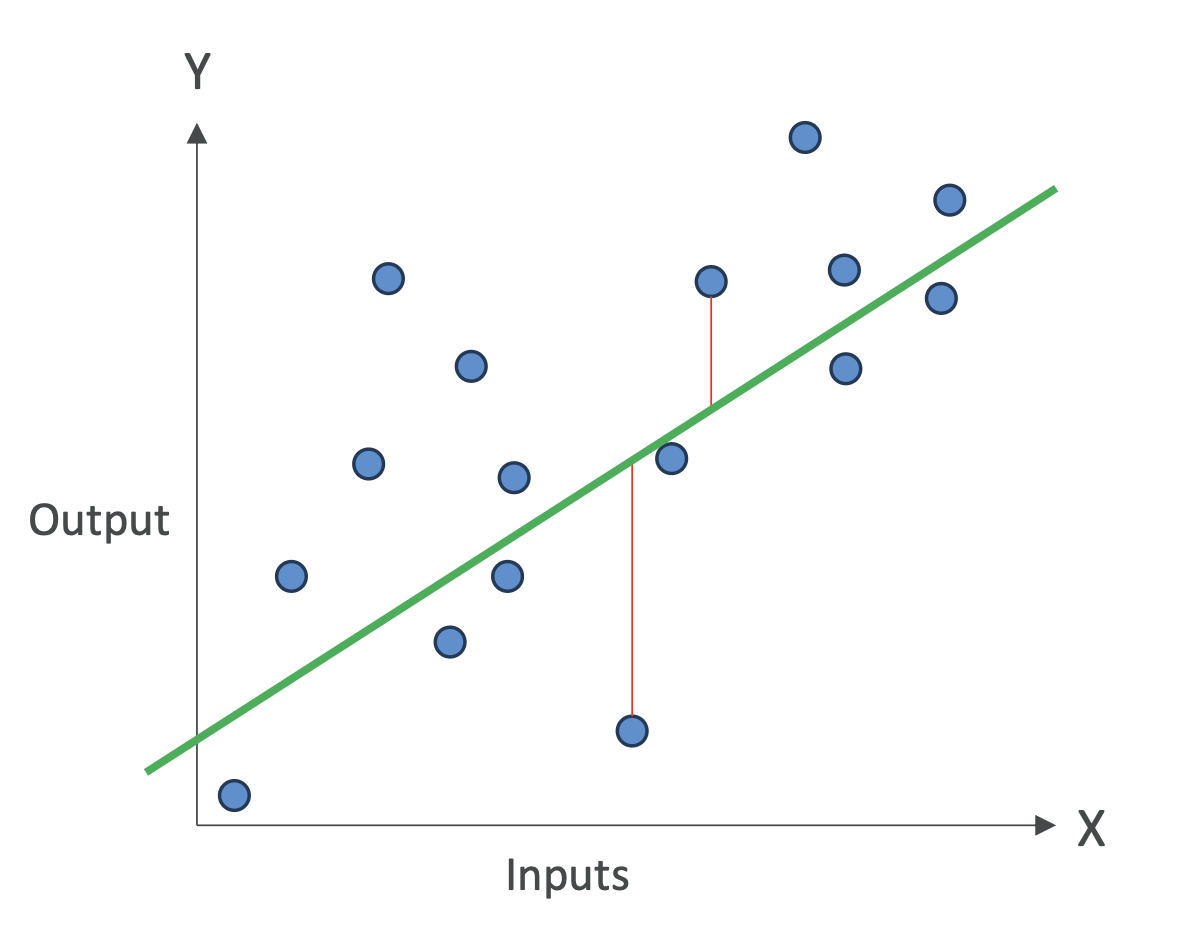
🔹 Regression Model Metrics
For regression (continuous predictions, e.g., house prices, stock
values), we measure errors:
MAE (Mean Absolute Error): average absolute difference between
prediction and truth.
→ Easy to interpret: “On average, the model is off by X units.”MAPE (Mean Absolute Percentage Error): average error as a
percentage.
→ Useful when scale of values matters (e.g., sales forecasts).RMSE (Root Mean Squared Error): penalizes large errors more
heavily than MAE.
→ Common when big mistakes are unacceptable.R² (Coefficient of Determination): measures how much variance in
the target is explained by the model.- R² = 0.8 → 80% of variation is explained by features, 20% by
noise/other factors.\ - R² close to 1 = strong model.
- R² = 0.8 → 80% of variation is explained by features, 20% by
🔹 Example (Regression Metrics in Action)
You predict student test scores based on study hours:
- RMSE = 5 → model predictions are ~5 points off on average.\
- R² = 0.8 → 80% of score differences explained by study hours,
20% due to natural ability or luck.
✅ Key Takeaways (Exam Perspective)
- Classification models → Confusion Matrix, Precision, Recall, F1,
Accuracy, AUC-ROC\ - Regression models → MAE, MAPE, RMSE, R²\
- Choose metrics based on business need:
- Precision for costly false positives\
- Recall for costly false negatives\
- F1 for imbalanced data\
- Accuracy only for balanced datasets